What is the Dashboard?
The Dashboard gives you an overview of activity and jobs in vWork. It is very customizable so that you can track the things that are important to you. It also enables you to set time-based goals and see how you are progressing toward meeting these.
The Dashboard is an optional feature. If you would like to add it to your account or find out more about it, please email support@vworkapp.com. One of our team will be in touch to talk with you about your requirements.
In this article
This article explains how to get users up and running with the Dashboard and how to customize the Dashboard so it gives you the information you want. Topics in this article include:
- Dashboard User Permission
- The Dashboard layout
- Full-screen view
- Customize the Dashboard
- Good to know
Dashboard User Permission
Once the Dashboard is enabled in your vWork account by us, you need to give the Dashboard User Permission to each user that you want to have access to the Dashboard.
Once their User Permission is granted they can see the Dashboard tab in the vWork menu.
To grant User Permissions for the Dashboard:
- Go to Settings > Users.
- Select a User you want to add the Dashboard Permission to from the User Management list and click to open their User Profile.
- Scroll to User Permissions and click the checkbox under Dash to select the Dashboard Permission.
- Click Update.

The Dashboard layout
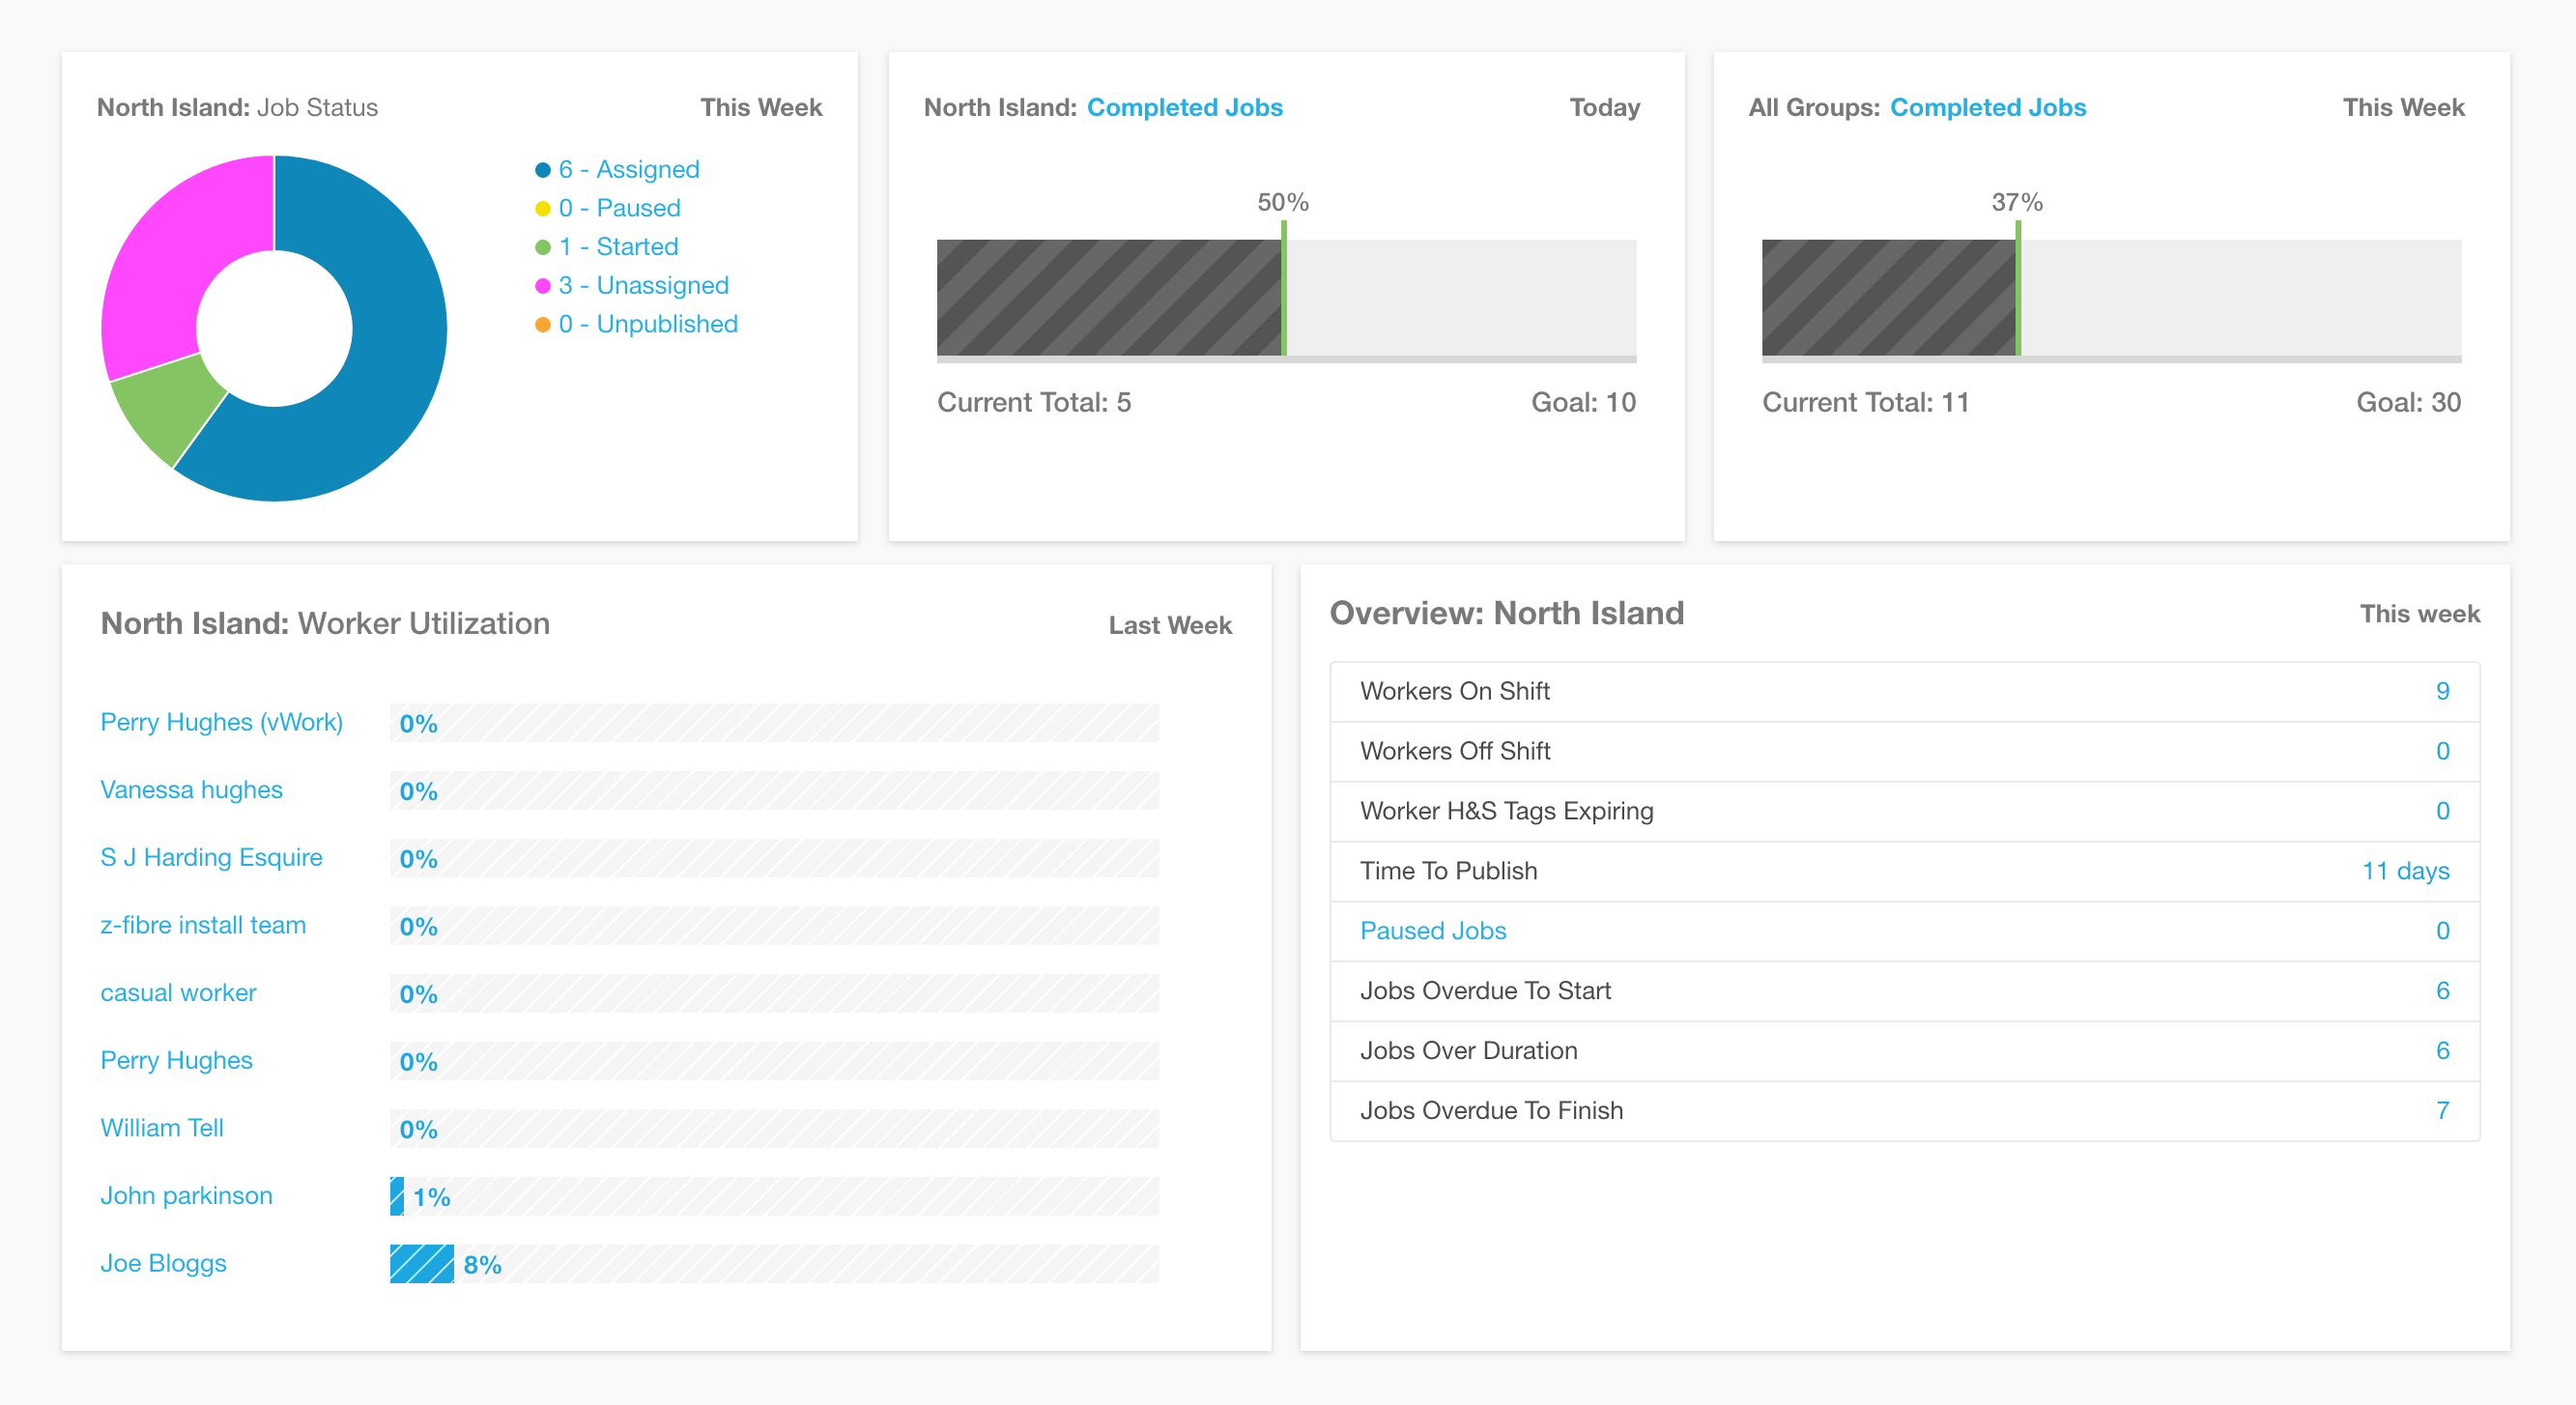
When you first open the Dashboard it will look similar to this.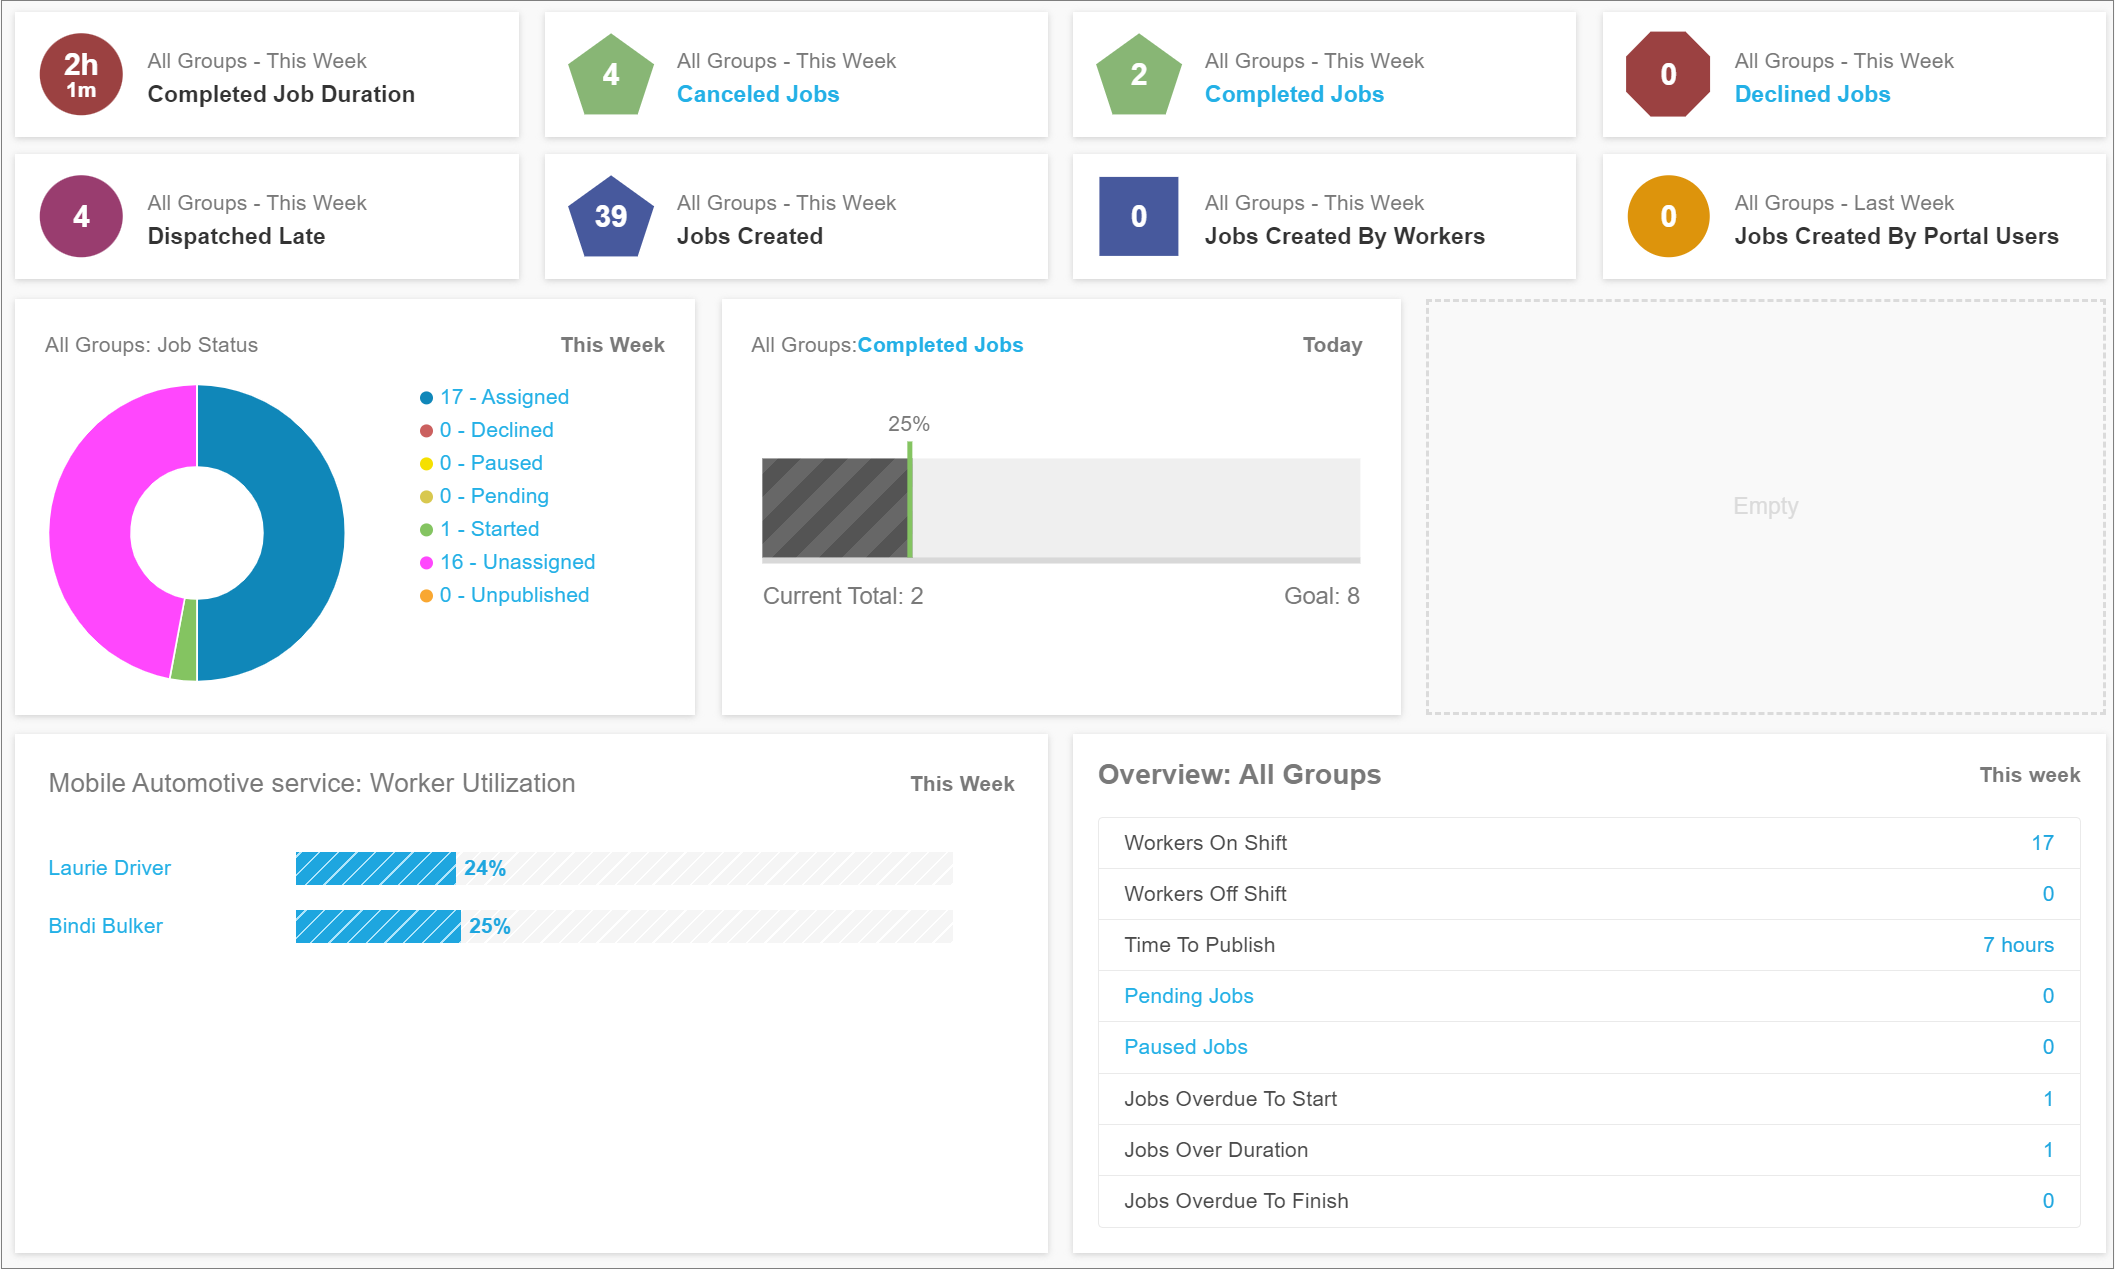
Dashboard sections
The Dashboard has three customizable sections.
Note: This topic shows the sections in their default order, but you can shuffle them around to suit your preferences. See below for more information.
Top section: Activity widgets
Use these widgets to quickly get an overview of key activities in your work account. You can add to these widgets, change them, or remove them to suit your requirements.
Middle section: Pie Chart and Goal widgets
These widgets are also customizable to meet your needs.
The Pie Chart widget is used to report several things at once (such as Job Status) in a single pie chart. You can add additional pie charts.
The Goal widget lets you set targets for Completed Jobs in a given time frame.
Bottom section: Worker Utilization and Overview
The worker utilization chart shows what percentage of each worker's time is assigned to jobs for a given time frame. The default is for this Week. You can customize this by Group and time frame. You can also set up several utilization charts for different time frames or Groups.
The Overview provides the same information that you can get from the widgets in the top section, but here they are provided in a list format. You can customize the Overview to show different information from the Activity widgets in the top section so that you have a broader view of the activity in your vWork account.

Full-screen view
The Dashboard can be a helpful tool to display in a shared workspace for everyone to see. To improve the view of the Dashboard when it is on a central screen you can use the Full-screen option. This eliminates other information from showing on the screen so that you only see the Dashboard.
To activate the Full-screen view:
- Click the Full-screen icon on the Dashboard Menu bar.

To return the Dashboard to normal view:
- Tap Esc on your keyboard or click the exit icon
 in the corner of the screen.
Customize the Dashboard
You can customize every section in the Dashboard so that it shows you exactly what you want to see.
Activate or exit the Dashboard edit mode
To customize the Dashboard you need to activate edit mode.
- Click the Pencil Icon to activate edit mode.

When you are in edit mode a blue information bar shows at the top of the screen to let you know you are editing the Dashboard. The pencil icon also turns blue.
From edit mode you can add, delete, and customize widgets from all three sections of the Dashboard and add and remove entire sections. The editing process is explained below.
Once you have made the changes you want you can exit edit mode from within the blue information bar.
To exit edit mode:
- Click Exit edit mode in the blue information bar.

Edit the Top Section
Add a new widget card
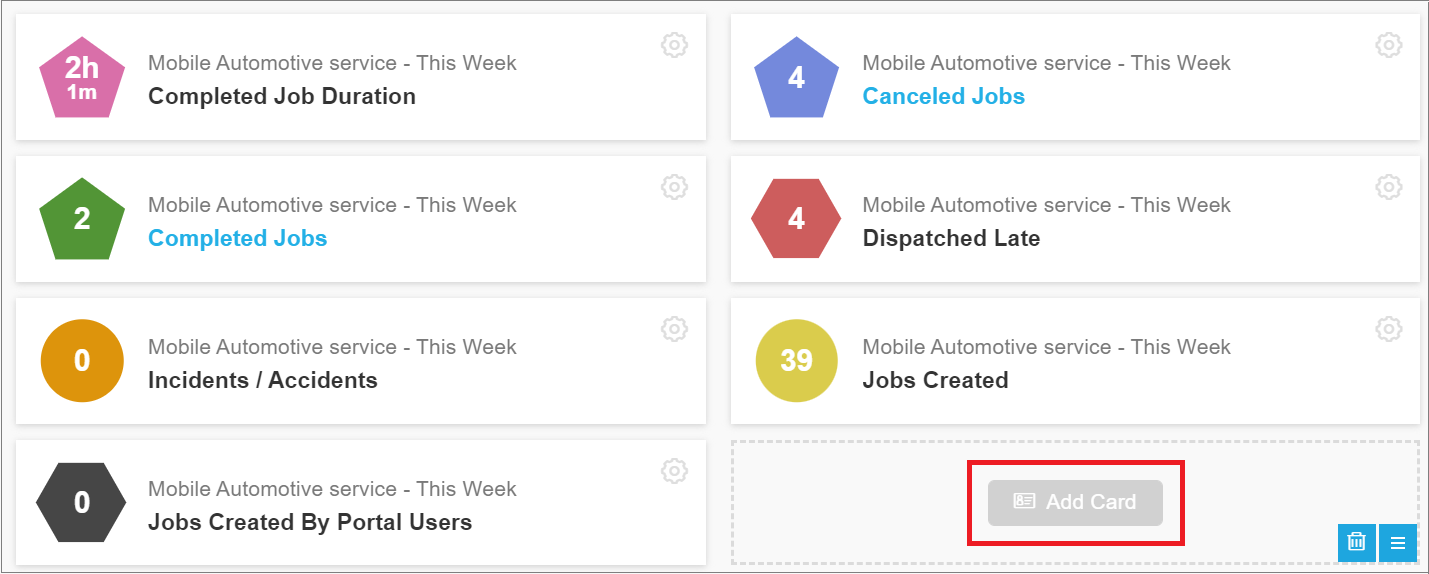
Widgets are shown in cards. You can easily add a new widget by adding and customizing a card.
To add a new widget:
- Click Add Card to open the Customise a widget pop-up window where you can choose the new widget's settings.
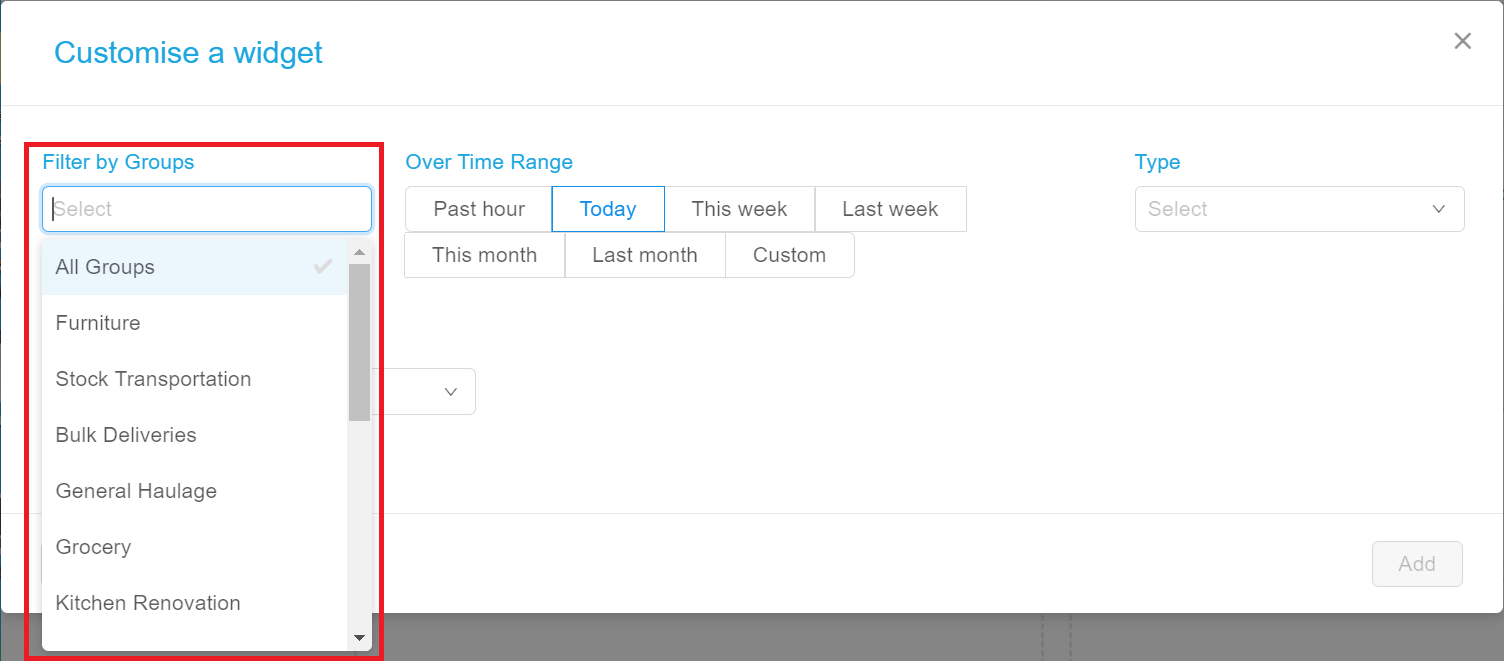
- If you have Groups activated in your account you can filter the widget to show information for one group, several groups, or all groups. Select the option you want from the Filter by Groups drop-down list.
- Next, choose the type of widget you want to show. Select from the drop-down list in the Type field.
Note: The Type you choose can change the time range options available to you for the Widget. That is why it is a good idea to select the Type before the time range.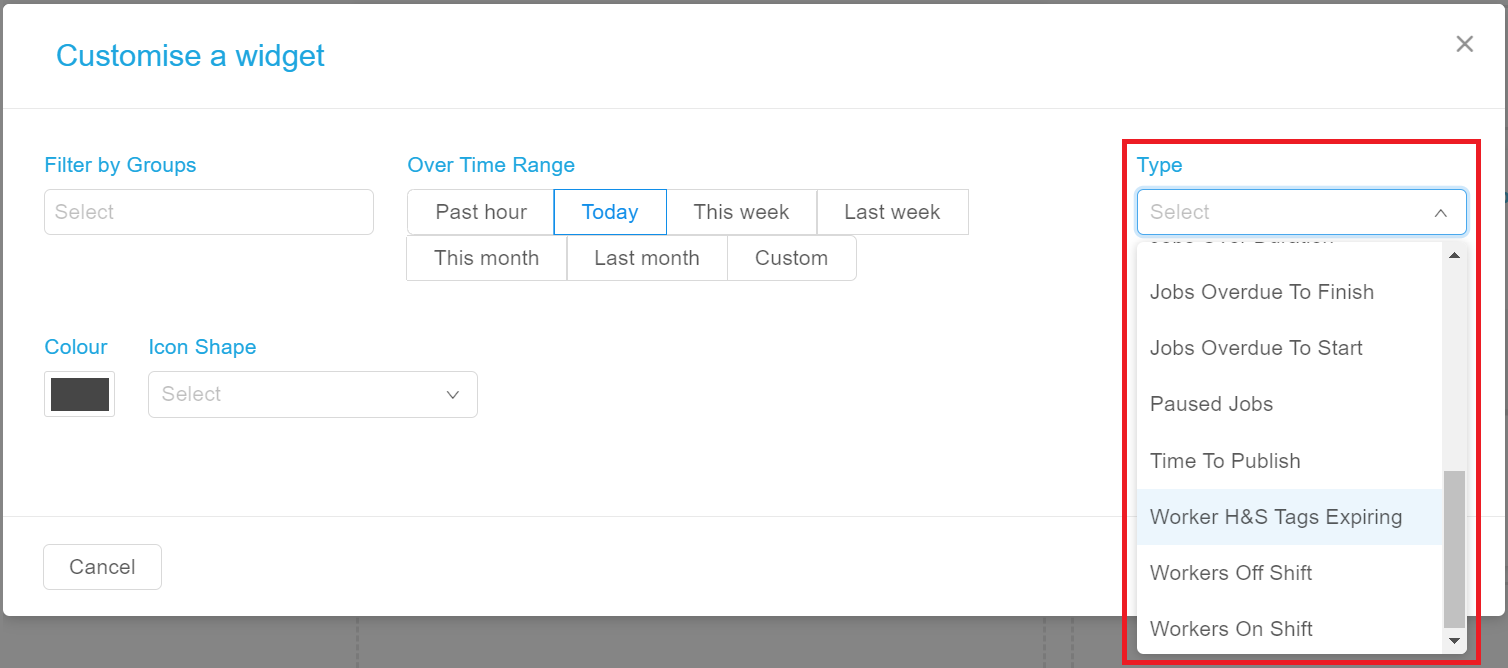
- Now choose the time range you want data for from the options available in Over Time Range.
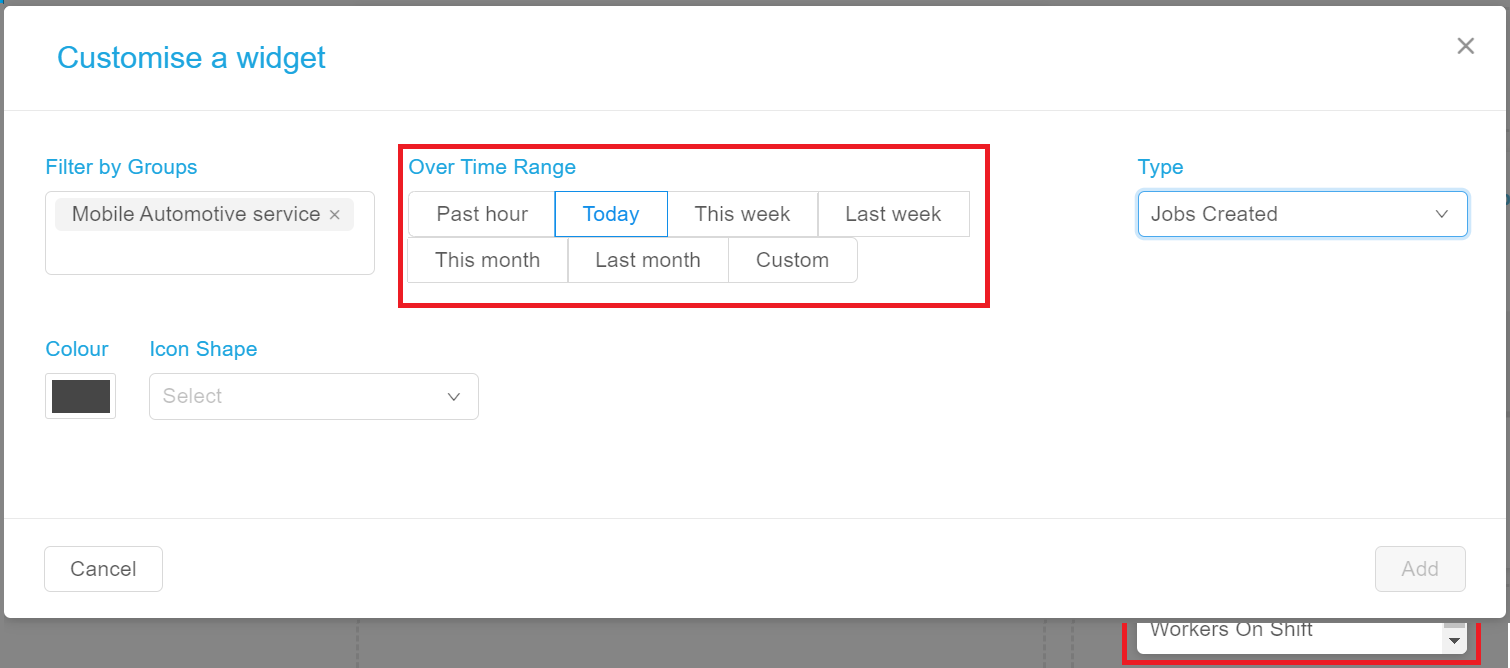
- Finally, select the color and shape to determine what the widget will look like from the Colour and Icon Shape options.
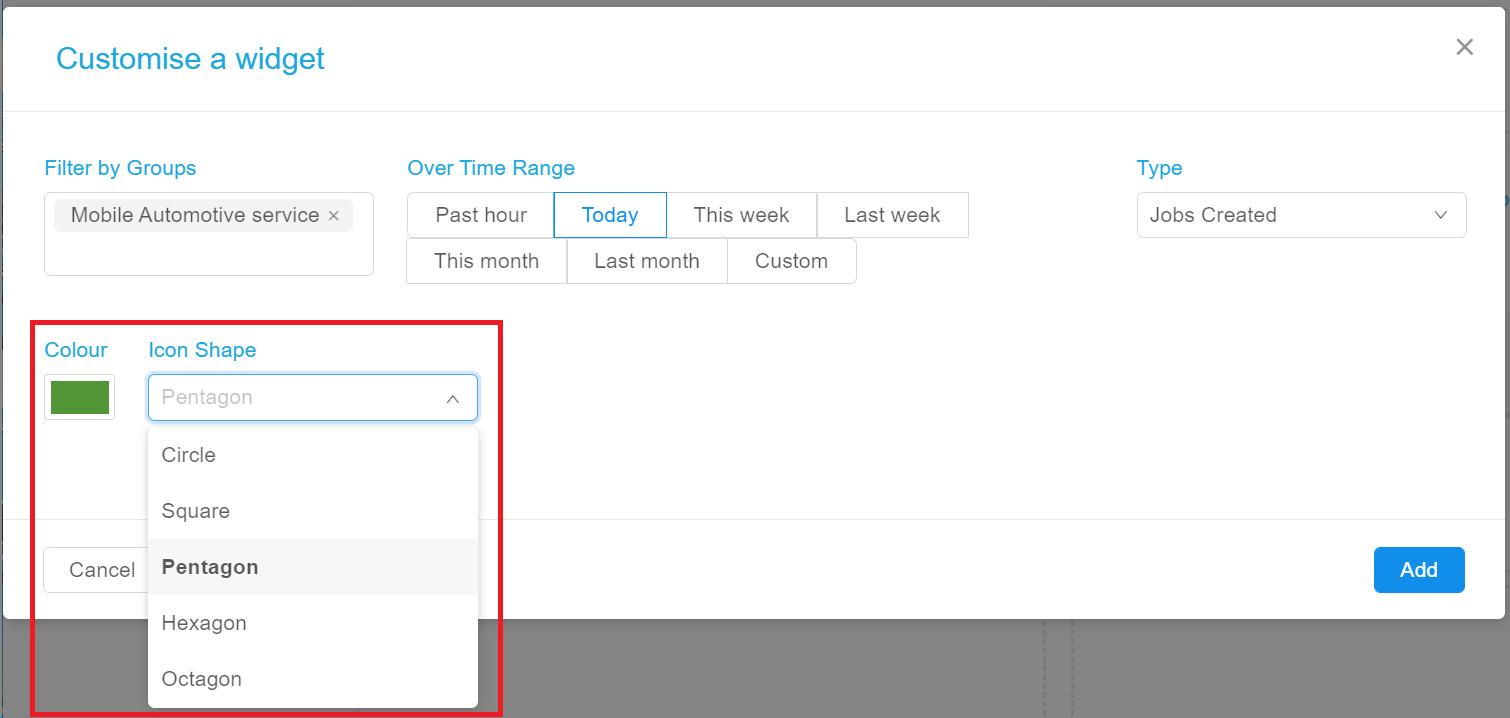
- Save your new widget and add it to the Dashboard by clicking Add.
Customize an existing widget card
You can easily customize an existing Widget using the same Customise a widget options you use when you create a new Widget.
To customize an existing Widget:
- Click
 in the top right corner of the Widget card to open the Customise a widget pop-up window.
Edit the Middle Section
You edit the middle section in much the same way as you edit widgets from the Top Section, however in the Middle section you add and edit Pie Chart widgets to show Job Status, and Goal progress chart widgets to show you how well you are heading toward goals that you set for completed jobs.
Add or edit a Pie Chart
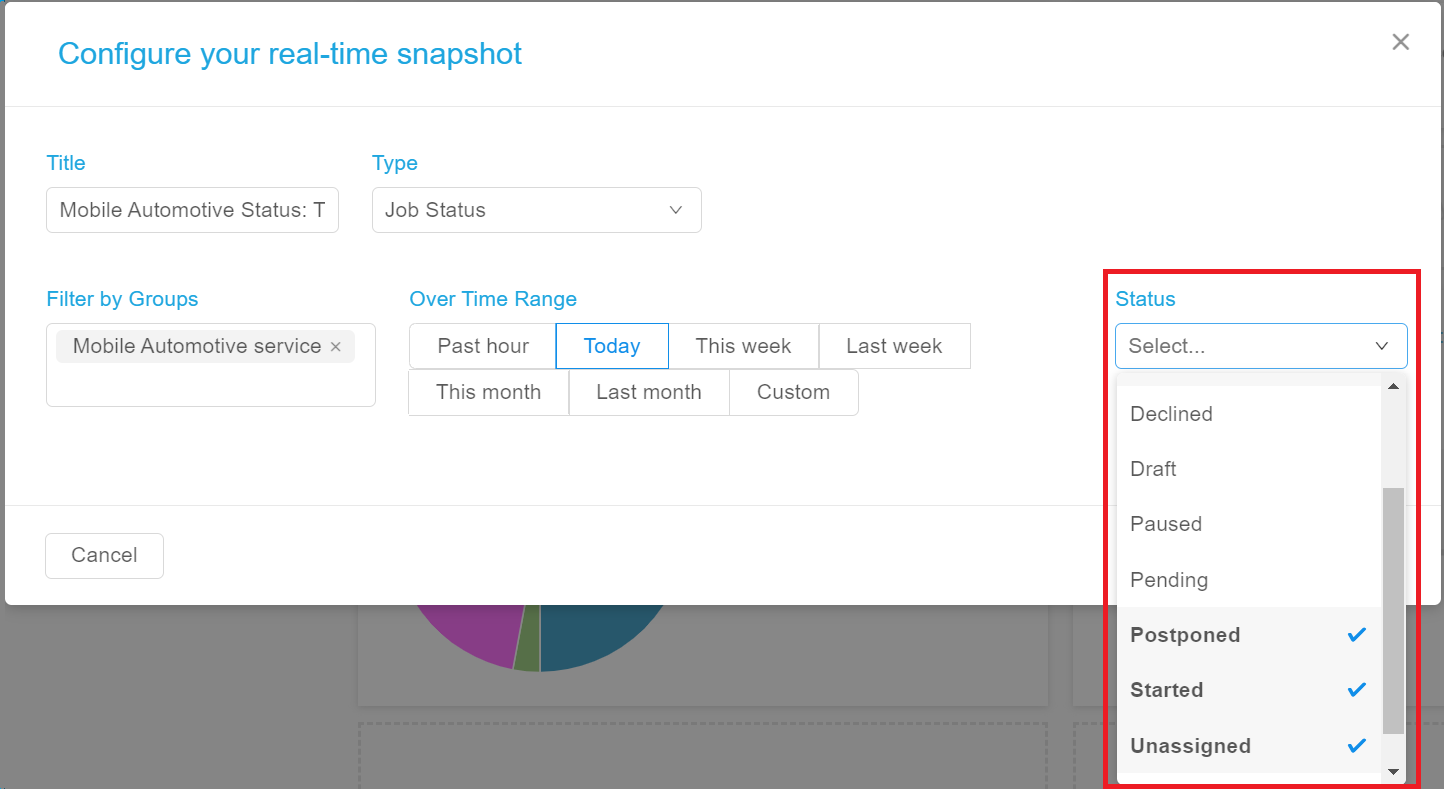
You add or edit a Pie Chart widget in the Configure your real-time snapshot pop-up window for the Pie Chart widget.
To open the Configure your real-time snapshot pop-up window and customize the widget, either:
- Click
 in the top right corner of a Pie Chart widget to edit the widget, or
click Add Pie Chart from the widget card to add a new Pie Chart widget. - Give the Pie Chart a Title, select a Type (the type selection will change with the optional add ons you have added to your vWork account - the default is Job Status), choose the Group or Groups from the Filter by Groups option, choose a time range from the Over Time Range Options.
- Select the Job status from the Status drop-down list. You can select several job statuses to show on the Pie Chart widget. Make sure to include a checkmark next to every status you want to show.
- Click Add or Update to save the pie chart widget.
Add or edit a Goal widget
You add or edit a Goal widget in the Configure your real-time snapshot pop-up window. This has the same filters as the Pie Chart widget version of this pop-up window but it also includes a field called Goal.
To open the Configure your real-time snapshot pop-up window and customize the widget, either:
- Click
 in the top right corner of a Goal widget to edit the widget, or
click Add Progress from the widget card to add a new Goal widget. - Choose the Group or Groups from the Filter by Groups option, choose a time range from the Over Time Range Options, and select a Type (Completed Jobs is the default Type).
- In the Goal field type a number as your goal. For example, you may plan to complete 40 jobs for this week or 8 Jobs for today.
Note: You don't have to enter a value in the Goal field. If you don't, vWork will calculate a Goal value for you. - Click Add or Update to save the Goal widget.

Edit the Bottom Section
The bottom section shows a summary of worker utilization as a percentage of each worker's hours for the selected time frame and an Overview of your chosen activities in a list. These are also edited in the same way as the other sections.
Add or edit a Utilization widget
The Utilization widget is customized in the Configure Worker Utilization pop-up window.
To open the Configure Worker Utilization pop-up window and customize the widget:
- Click
 in the top right corner of a Utilization widget to edit the widget, or
click Add Utilization from the widget card to add a new Utilization widget. - Choose the Group or Groups from the Filter by Groups option, choose a time range from the Over Time Range Options, and select a Type (Worker Utilization is the only option).
- Click Add or Update to save the Utilization widget.

Add or edit an Overview widget
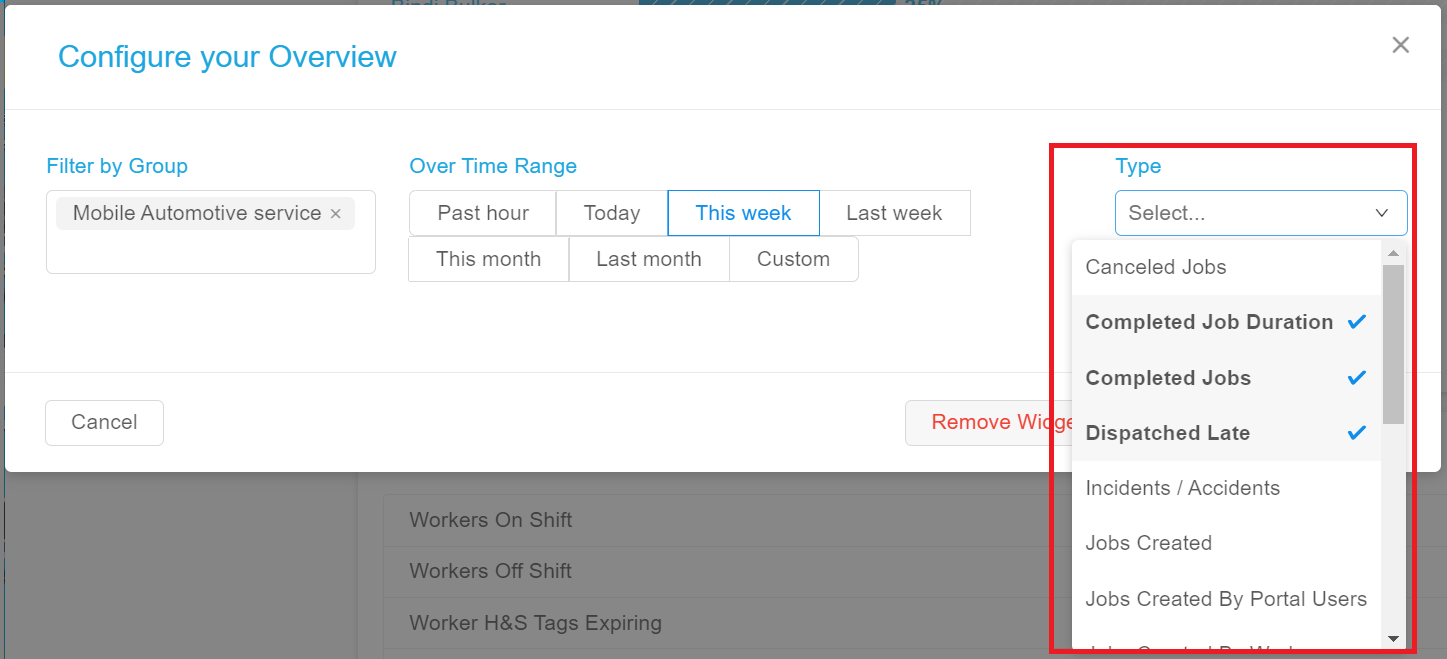
The Overview widget is customized in the Configure your Overview pop-up window.
To open the Configure your Overview pop-up window and customize the widget:
- Click
 in the top right corner of an Overview widget to edit the widget, or
click Add Overview from the widget card to add a new Overview widget. - Choose the Group or Groups from the Filter by Groups option, choose a time range from the Over Time Range Options, and select the Types of widgets you want in the Overview list. You can select several widget types. Make sure to include a checkmark next to every type you want to show.
- Click Add or Update to save the Utilization widget.
Add a new section
You may want to have more than one section of the same type on your Dashboard; for example, if you want to show the same statistics but for several different groups.
To add a new section:
- Make sure you are in edit mode.
- Click
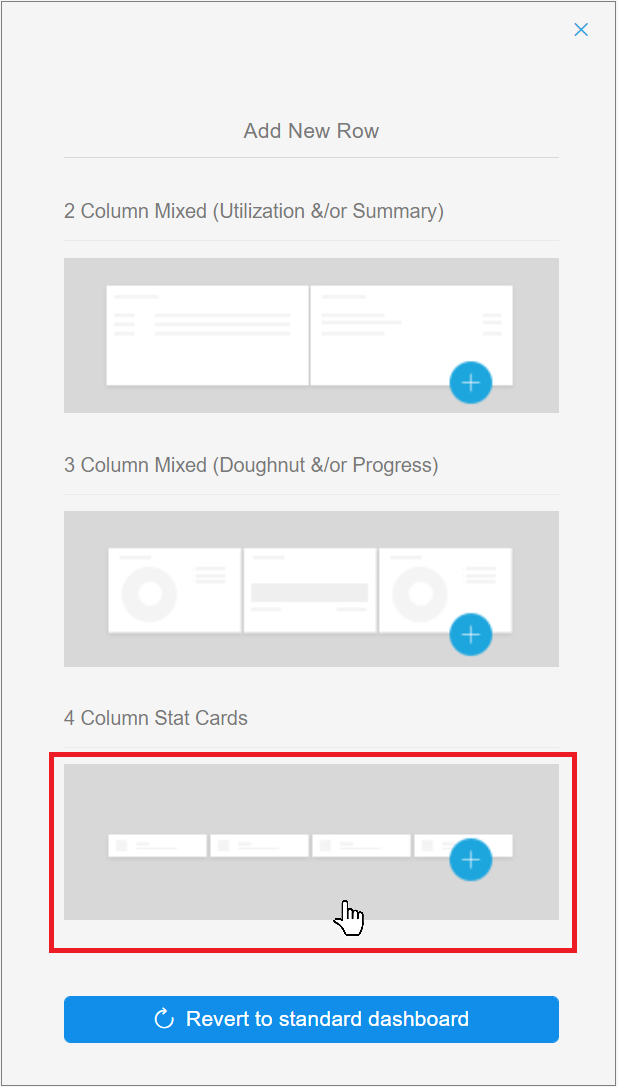
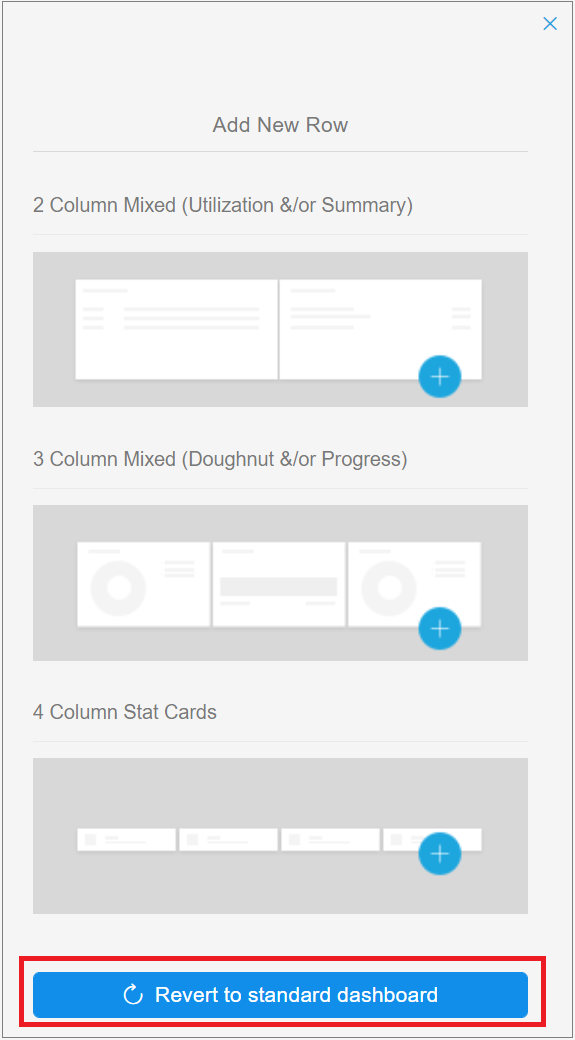
 from the Dashboard menu to open the Add New Row side menu. This shows three options, one for each section.
 - Click the icon that represents the section you want to add. In this example, we are adding a section of Activity widgets that match the widgets in the Top Section of the Dashboard.
The section is added above the other sections in the dashboard.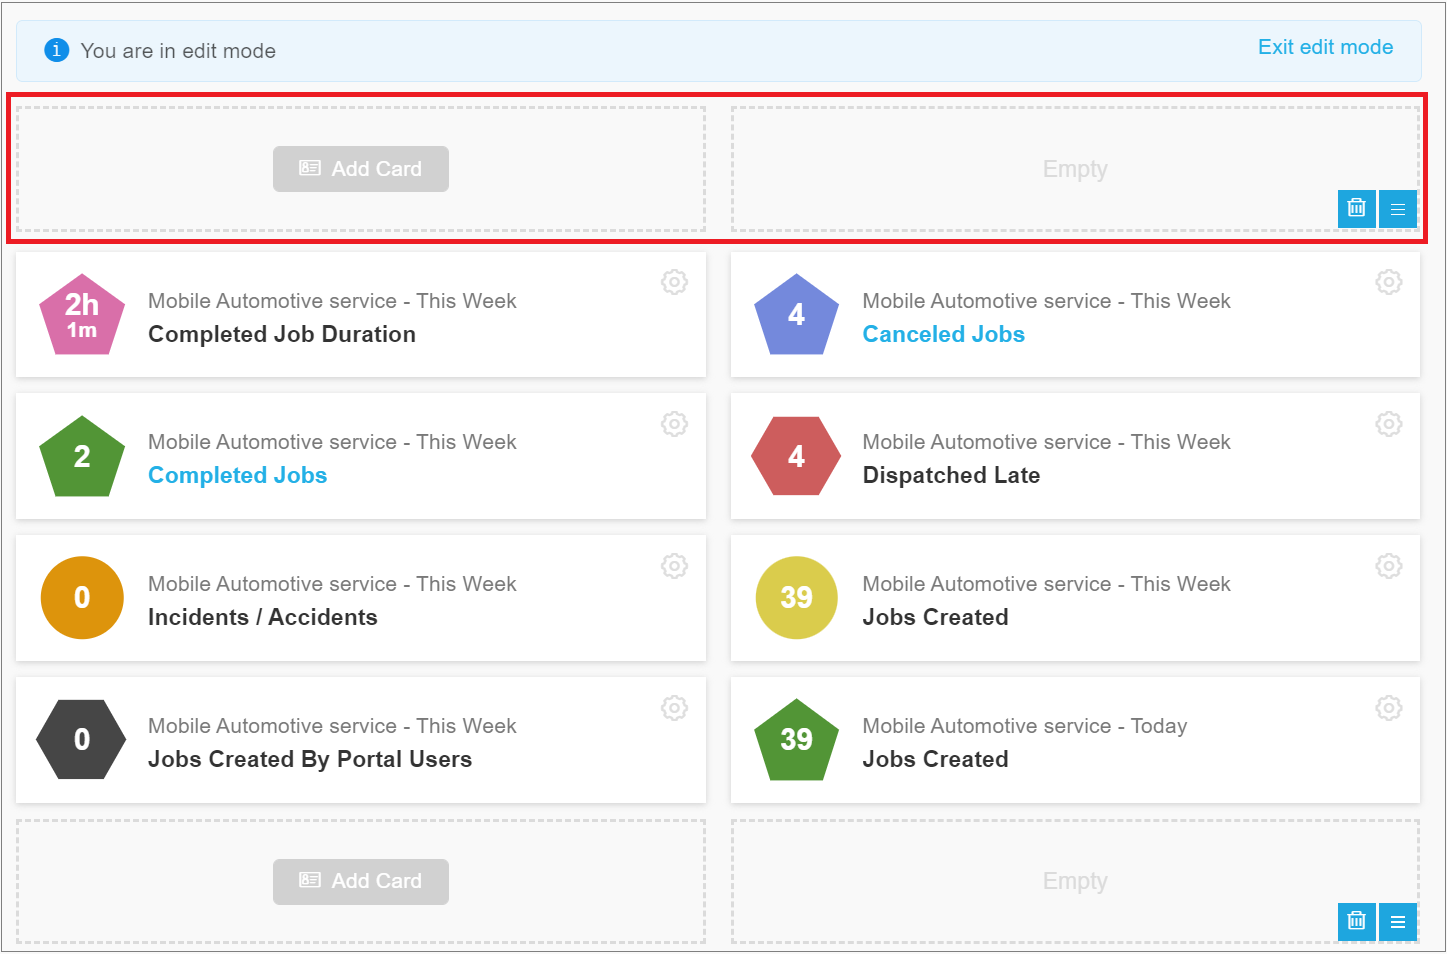
Move a section
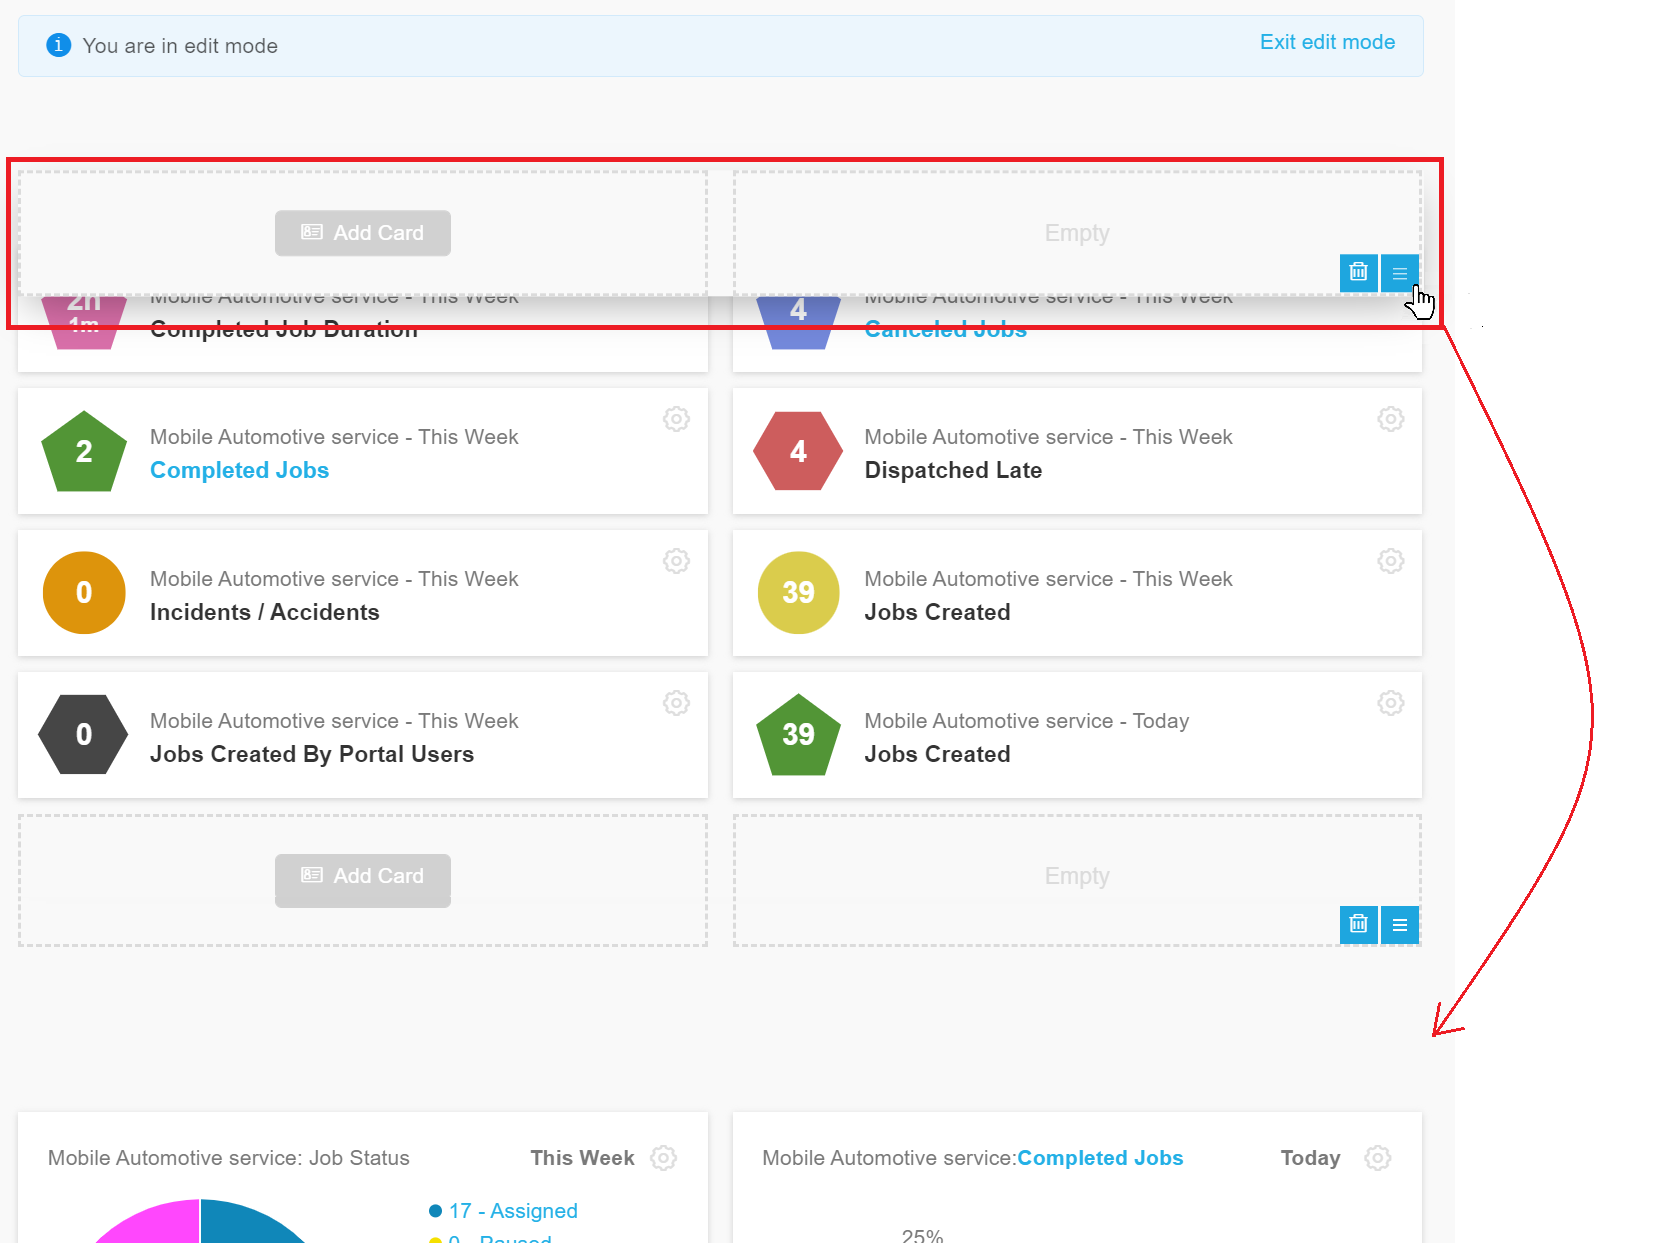
You can shuffle the sections around the Dashboard so they display in the order you want.
To move a section:
- Click and hold
 found in the bottom right corner of the section.
 - Drag the whole section up or down the Dashboard to reposition it where you want.
Delete a section
You can delete a whole section from the Dashboard.
Caution: Make sure you don't require any of the widgets in the section before you delete it. Once deleted the widgets can't be recovered with customized settings. You can restore the default settings if you need to.
To delete a section:
- Click
 found in the bottom right corner of the section to delete the section.
Revert to the default Dashboard
You can revert to the default Dashboard at any time. This will remove any customization you have done to the Dashboard.
To revert to the default Dashboard:
- Make sure you are in edit mode.
- Click
 from the Dashboard menu to open the Add New Row side menu.
 - Click Revert to standard dashboard at the bottom of the menu.
Good to know
Time frame parameters
It is helpful to understand the data that you get based on the time frame parameters. Here is some useful information about how the time frames work in the Dashboard.
- The time range for This week runs from Sunday 00:00 am through to Saturday 11:59:59 pm.
- If you set the time range for Today it runs from the current time (now) until 11:59:59 pm tonight. But the next day it will start at 00:00:00 and include the full 24 hours.
- All the time frame options include jobs that are completed within the time frame or are scheduled to be completed within the time frame (unless these jobs are filtered out of the selection).
The Goal widget
The goal value set for a Goal widget can be set by the user or determined by vWork when the user doesn't enter a value in the widget's Goal field.
When vWork sets the goal we determine the goal target based on the number of jobs that are planned to be completed during the selected time frame (e.g, how many jobs are planned to be completed today).
The Planned to be completed parameter is calculated as the job's scheduled start date and time plus the job's duration. For example, You set the time frame for Today. At the current time, you've completed 20 jobs but you have 50 jobs that you still expect to complete today. The Goal widget will show the Current Total as 20, and the Goal as 50. This is represented on the Widget's bar diagram as 40%. As more jobs are completed during the day the percentage and Current Total will both increase to reflect the increase in completed jobs.